
A nutrition label can tell you that a meal contains 12 grams of fiber or 28 grams of protein. It does not automatically tell you why. That missing connection is where people often get stuck: the numbers are visible, but the food behind the numbers disappears.
Start with the meal you actually ate
Nutrition becomes more understandable when you begin with a real plate instead of an abstract target. Take a grain bowl: quinoa, chickpeas, avocado, vegetables, tahini, and perhaps tofu or chicken. The total calories and macros matter, but the ingredient list explains the structure of the meal.
Quinoa and chickpeas may account for a meaningful share of the carbohydrate and fiber. Tahini and avocado contribute much of the fat. Tofu or chicken shifts the protein picture. Vegetables can contribute vitamin C, potassium, folate, carotenoids, and volume without dominating the calorie count.
Ask “which ingredient is doing that?”
A useful way to read nutrition facts is to pick one number at a time and trace it back to the foods that contributed it. If sodium is high, is it coming from canned beans, a sauce, cheese, or a seasoning blend? If fiber is high, is it mostly from oats, legumes, berries, whole grains, or a mix? If calcium is meaningful, is dairy doing the work or are fortified foods involved?
This is the idea behind Feed Love: use structured food data for the nutrient values, then keep ingredient matches and assumed portions visible so the analysis can be corrected rather than silently accepted. The site currently describes its nutrition data as USDA-backed and separates AI-assisted parsing from the structured records used for nutrient totals.
Portion size is the quiet variable
Most nutrition disagreements are not really disagreements about the nutrient database. They are disagreements about what was eaten. “A bowl of pasta” can mean 250 calories or 800. “A spoon of peanut butter” can mean a measured tablespoon or an enthusiastic scoop. Recipes have the same problem when they leave quantities vague.
When you analyze a meal, check the portion assumptions before you interpret the result. If a tool assumed one cup and you ate two, fix that first. Feed Love explicitly surfaces assumed amounts when quantities are missing, which is the right kind of friction: it reminds you that the input matters.
Use Daily Value as orientation, not a grade
Percent Daily Value can help you judge whether a serving contributes a little or a lot of a nutrient, but it is not a personalized prescription. Individual needs vary with age, body size, activity, pregnancy, medical conditions, medications, and other factors. For clinical nutrition questions, a qualified professional is the right source.
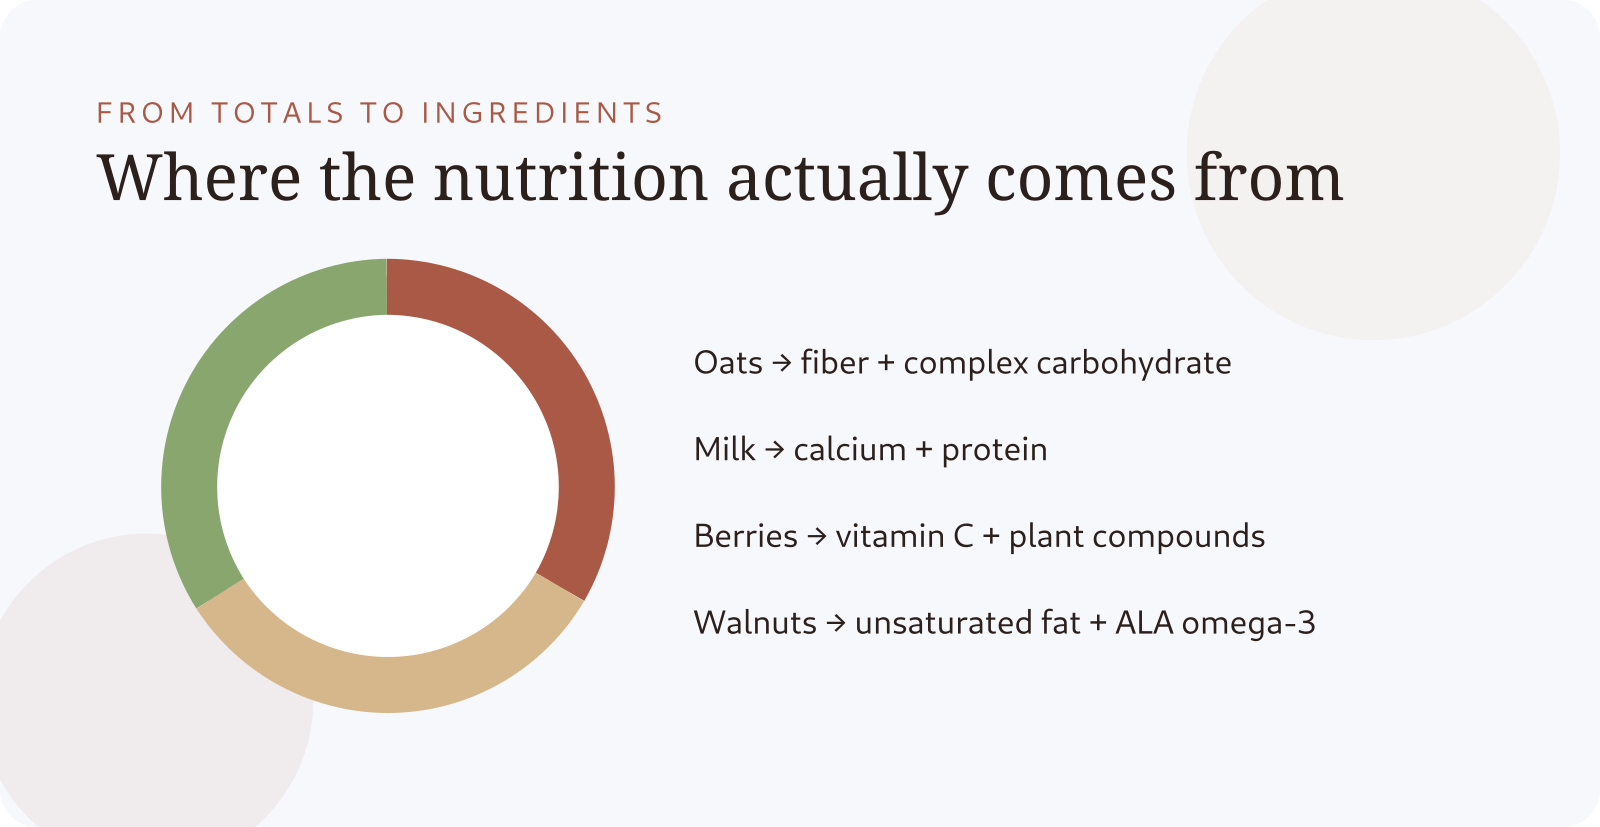
For everyday learning, though, Daily Value is a useful compass. It can reveal that a seemingly small ingredient is carrying much of the sodium, or that a breakfast you thought was low in fiber actually gets meaningful fiber from oats, berries, and nuts together.
A better way to compare two foods
Instead of asking which food is “healthier,” compare them for the job you need them to do. If you are choosing between two breakfasts, you might care about protein, fiber, added sugar, sodium, and how filling the meal is likely to be. If you are comparing cooking oils, the relevant questions are different. Context changes the comparison.
That is why ingredient-level nutrition is more useful than a single score. A score compresses trade-offs. A breakdown lets you see them.
Try this with your next recipe
- List the ingredients and approximate amounts.
- Check the serving count.
- Look at the total nutrition.
- Pick two or three nutrients you care about.
- Trace each one back to its biggest ingredient contributors.
- Adjust an ingredient or portion and see what actually changes.
You do not need to turn every meal into a spreadsheet. The point is to make the numbers legible enough that they teach you something about food. Once you can see which ingredients create the totals, nutrition facts stop feeling like a verdict and start functioning like a map.
Explore the brand: feedlove · View its LogicWeb Network profile